État d'Âme
Back to État d'Âme

See how the organization is doing, without seeing anyone in it.

Workplace wellbeing data is only worth having if the people it describes can trust it. On État d'Âme employees own their results and decide separately whether to be counted, administrators read group averages and never a name, and any group too small to be anonymous is simply not reported.

Organization admin

Runs the account.

Can
Invite employees, manage seats and roles, set reporting policy, and read group trends.
Cannot
See any individual's scores, history, or whether a named person reports at all.

Employee

Owns the data.

Can
Use the full personal app, and choose separately whether to be included in organization reporting.
Always true
Joining the organization and being counted in its reporting are two decisions, and the second one is opt in.

The reporting floor

A rule, not a person.

Always on
A group needs five or more active members before any figure is shown for it.
Below the floor
The row reads “Data suppressed” and keeps reading that until the group is large enough to be anonymous.
Organization Overview

Four indices, one organization, no individuals.

Organization Overview is the reporting side of the account. Everything on it is an average across people who opted in, which means it can answer whether the organization is under strain and cannot answer who is.

  • Aggregate cognitive wellnessExecutive Regulation, Attention Stability, Cognitive Speed and Burnout Resilience, each an organization average from 0 to 100, with the month's movement beside it.
  • Trend over timeEight weeks of weekly averages for all four indices on one chart, so a change reads as a direction rather than a single number.
  • Participation you can actually seeA funnel from invited, to joined, to included in reporting. The gap between the last two is people who chose not to be counted, and it is meant to be visible.
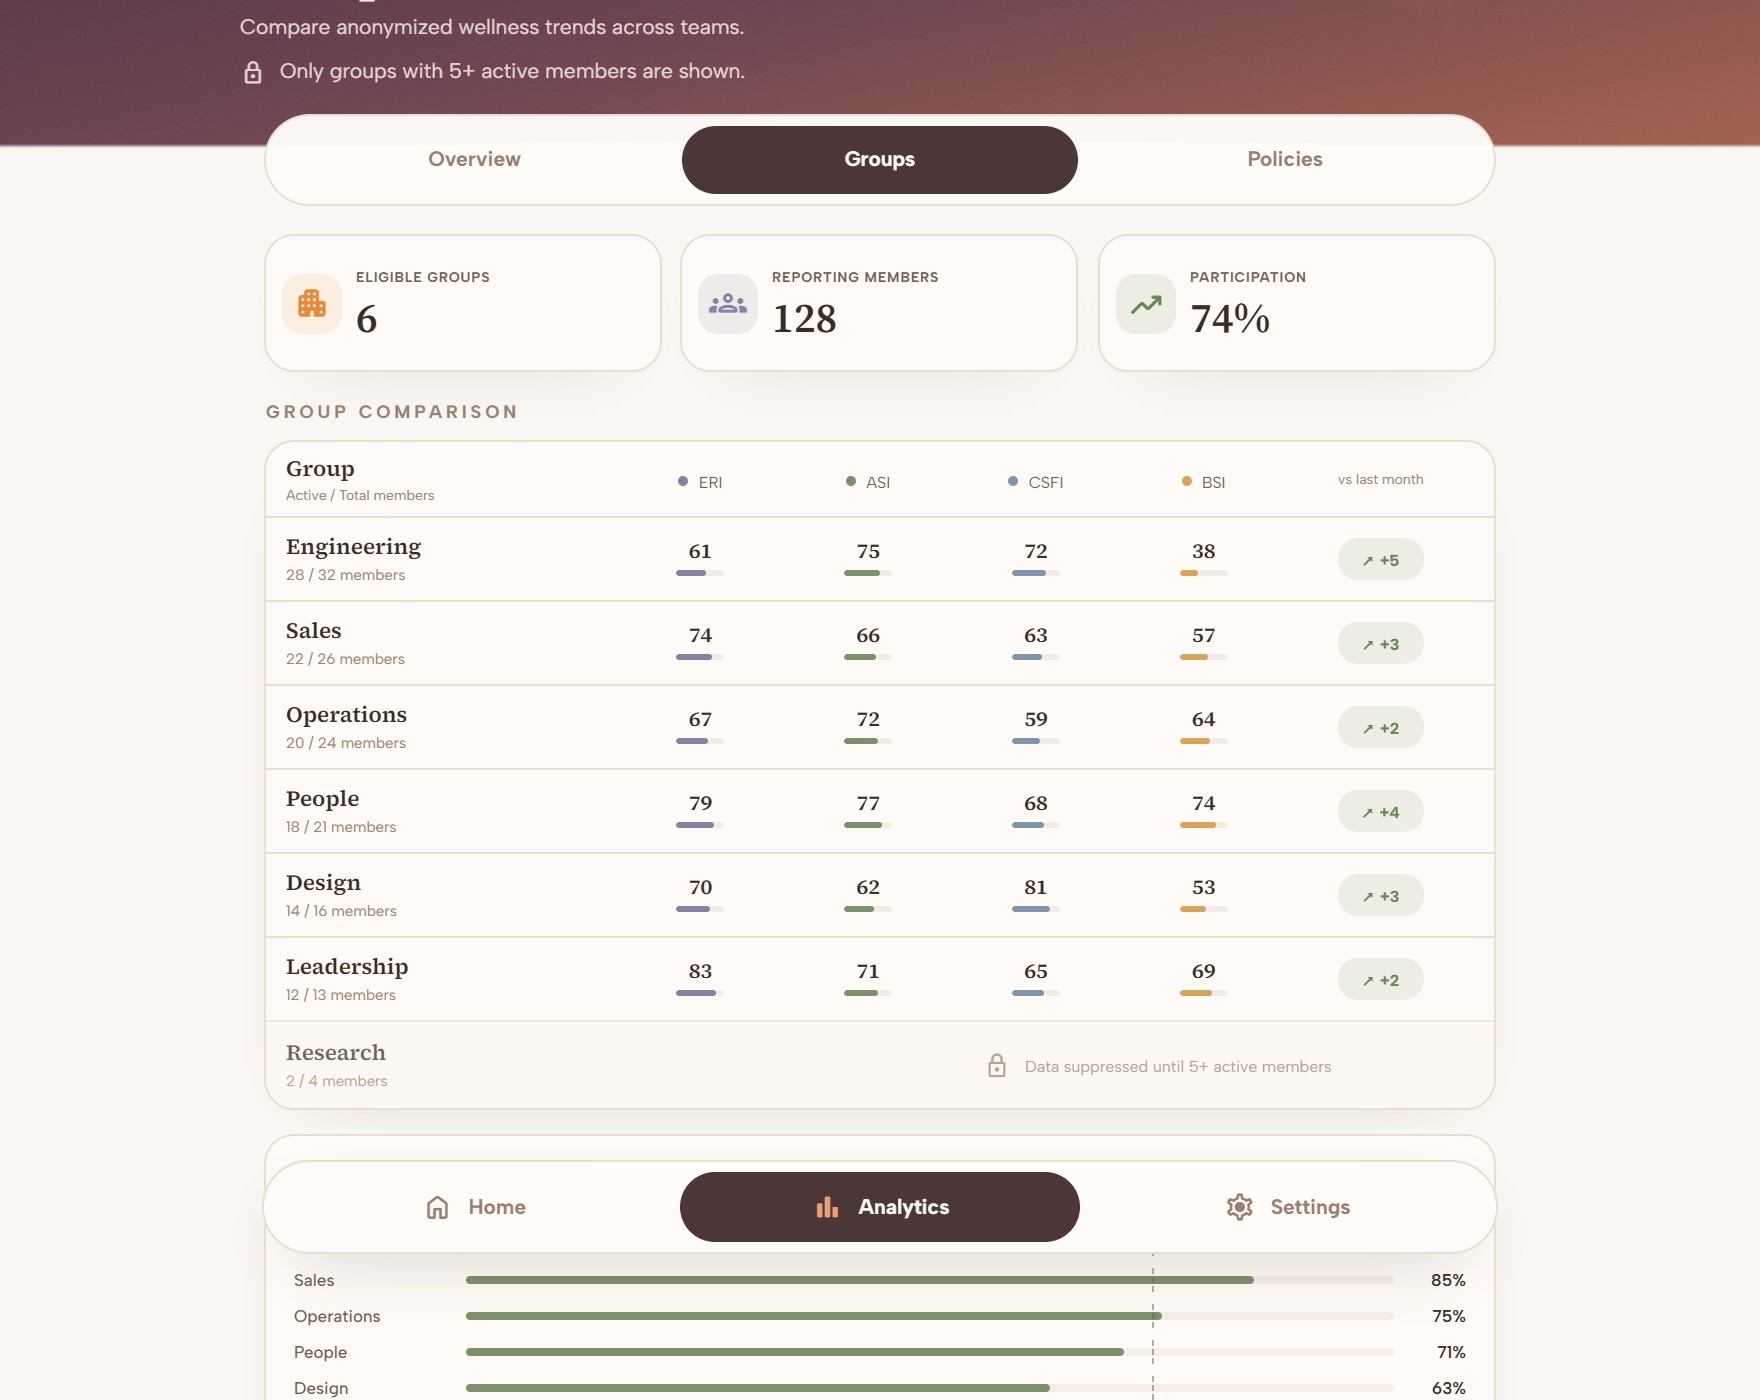
  • Group comparisonEvery team that clears the reporting floor, side by side, with the month's movement. Teams below it stay suppressed rather than being folded in somewhere else.

“Only aggregate trends are shown. No personal scores are visible.”

Shown under the title of every Organization Overview screen
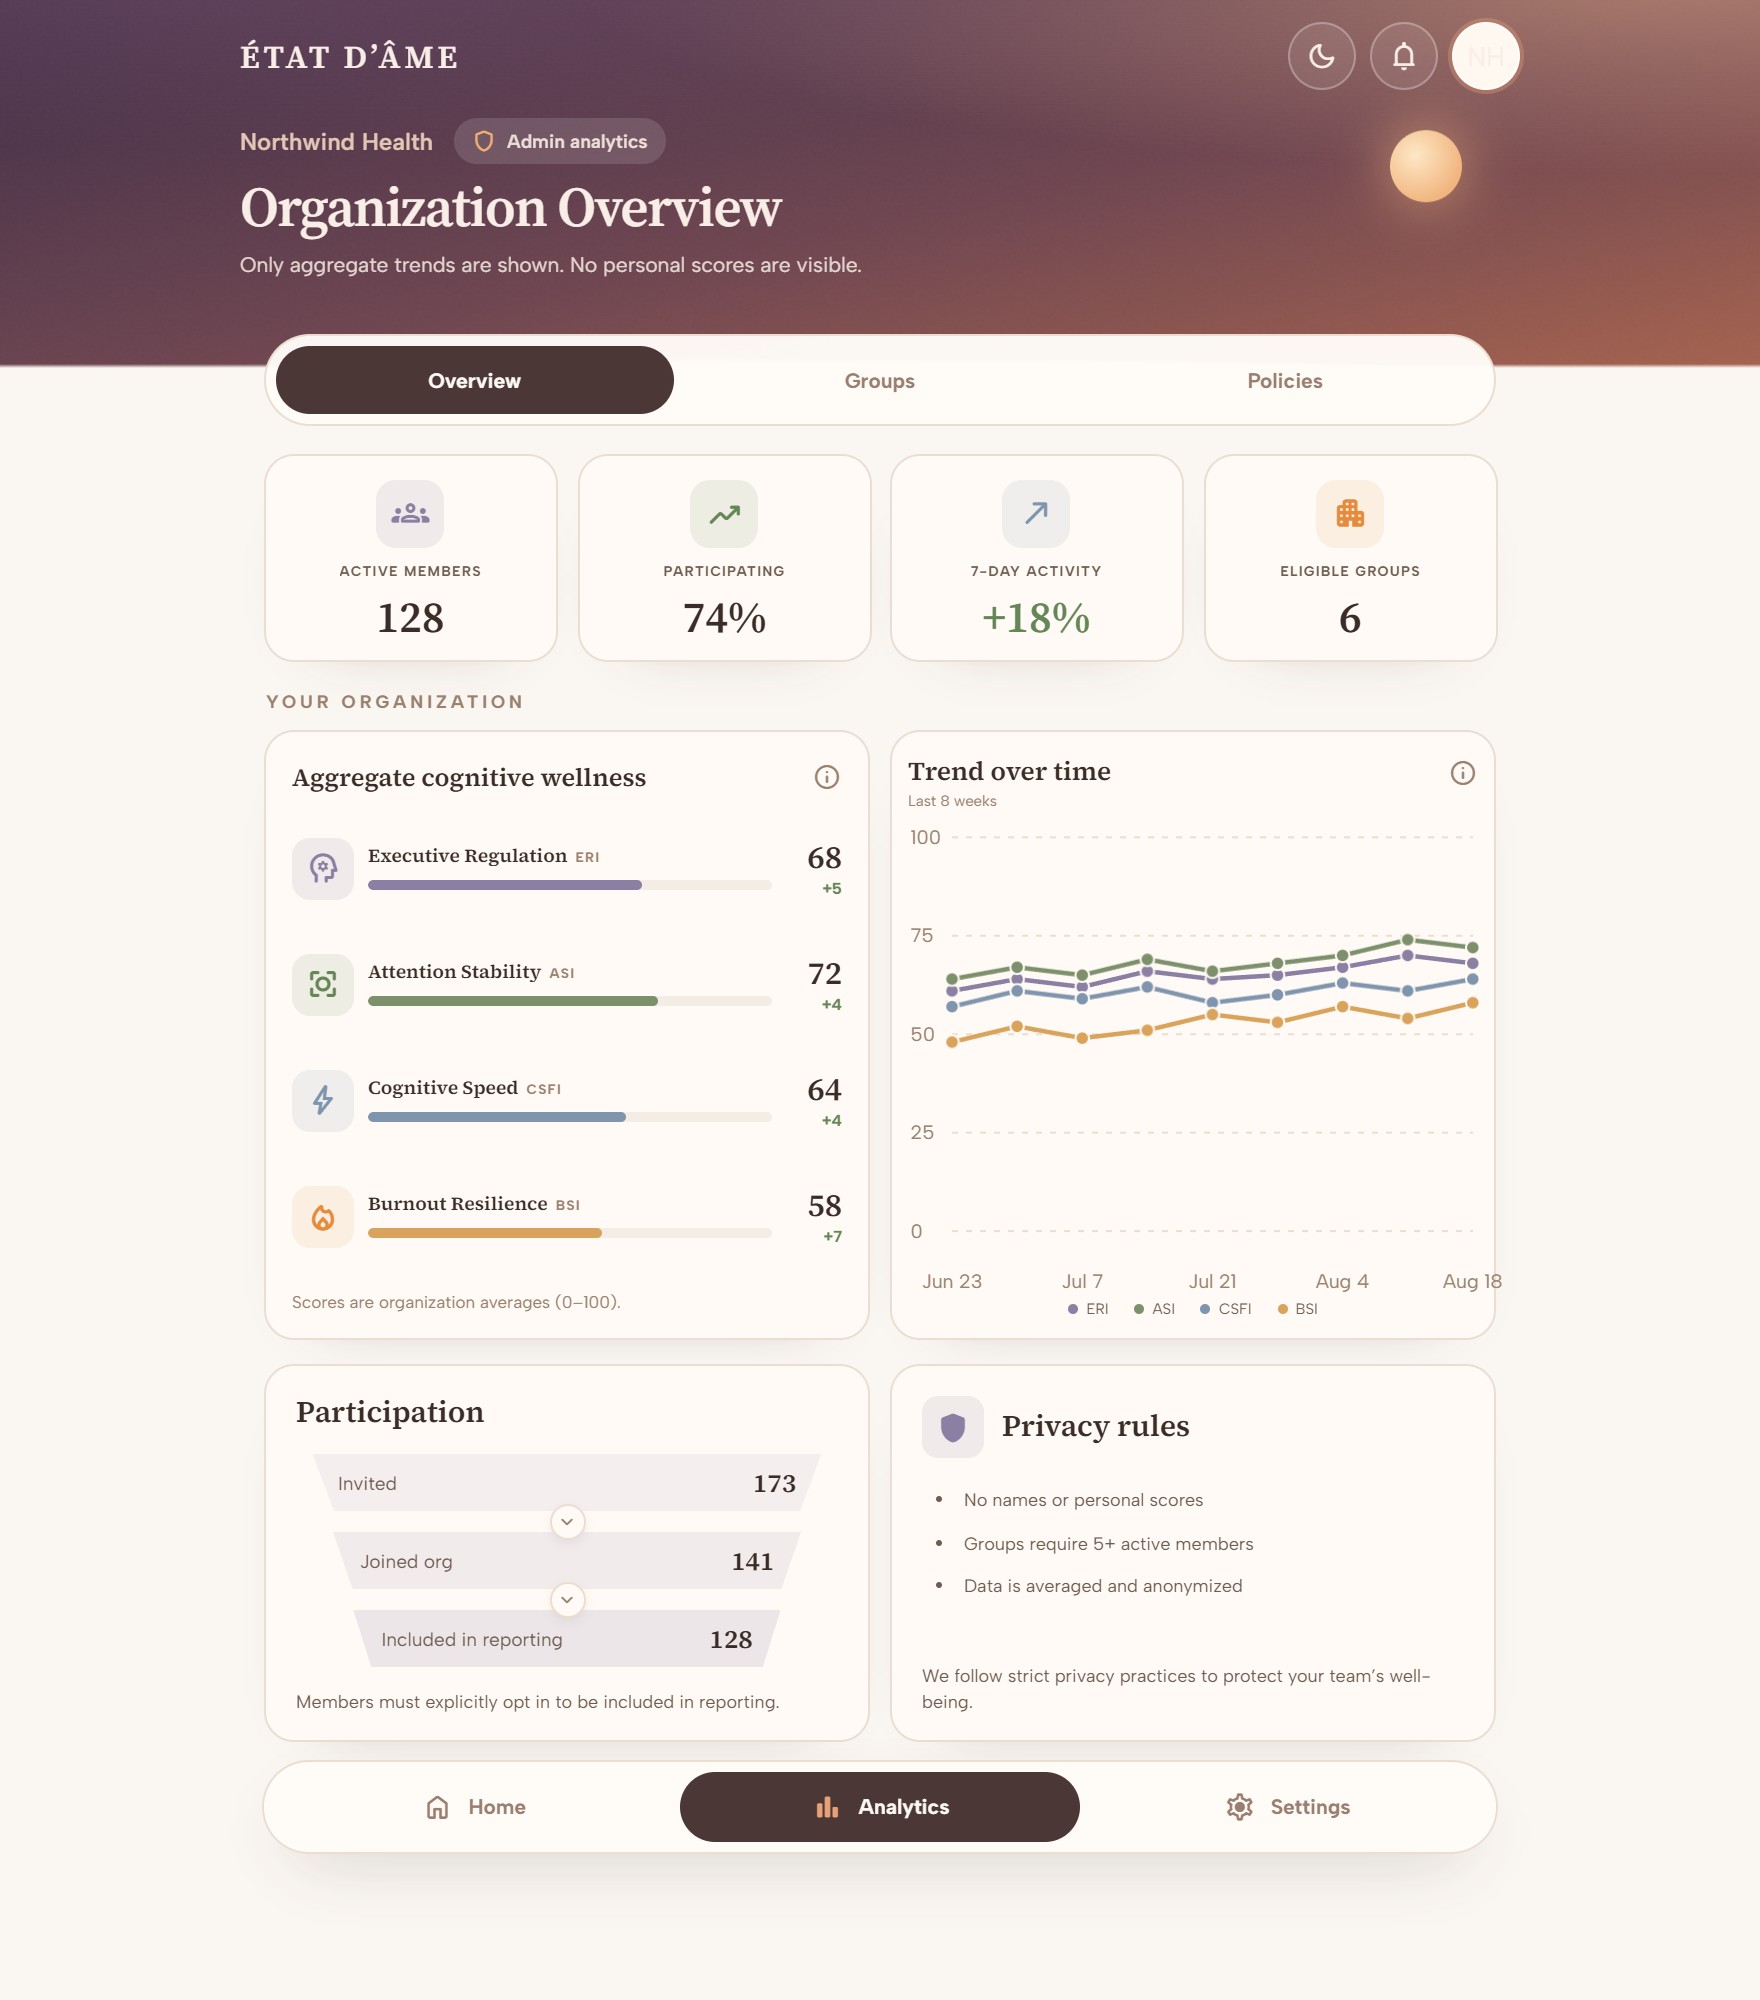
The Organization Overview screen: 128 active members, 74 percent participating, activity up 18 percent over seven days, six eligible groups, the four wellness indices as organization averages, an eight week trend chart, and a participation funnel from 173 invited to 128 included in reporting.
The group comparison table: six teams with their four index scores and monthly movement, and a Research group of two members whose row reads Data suppressed until 5+ active members.

The reporting surfaces: the aggregate view, and a group comparison with one team held back below the floor.

Account administration

Run the account, and stop there.

The administrative side is a separate surface from the reporting one, and it is built around people, seats and access. It holds membership and invitation records, and no assessment data of any kind.

  • Seats and invitationsPurchased seats, seats in use, seats reserved by invitations still awaiting acceptance, and any invitation whose email did not arrive.
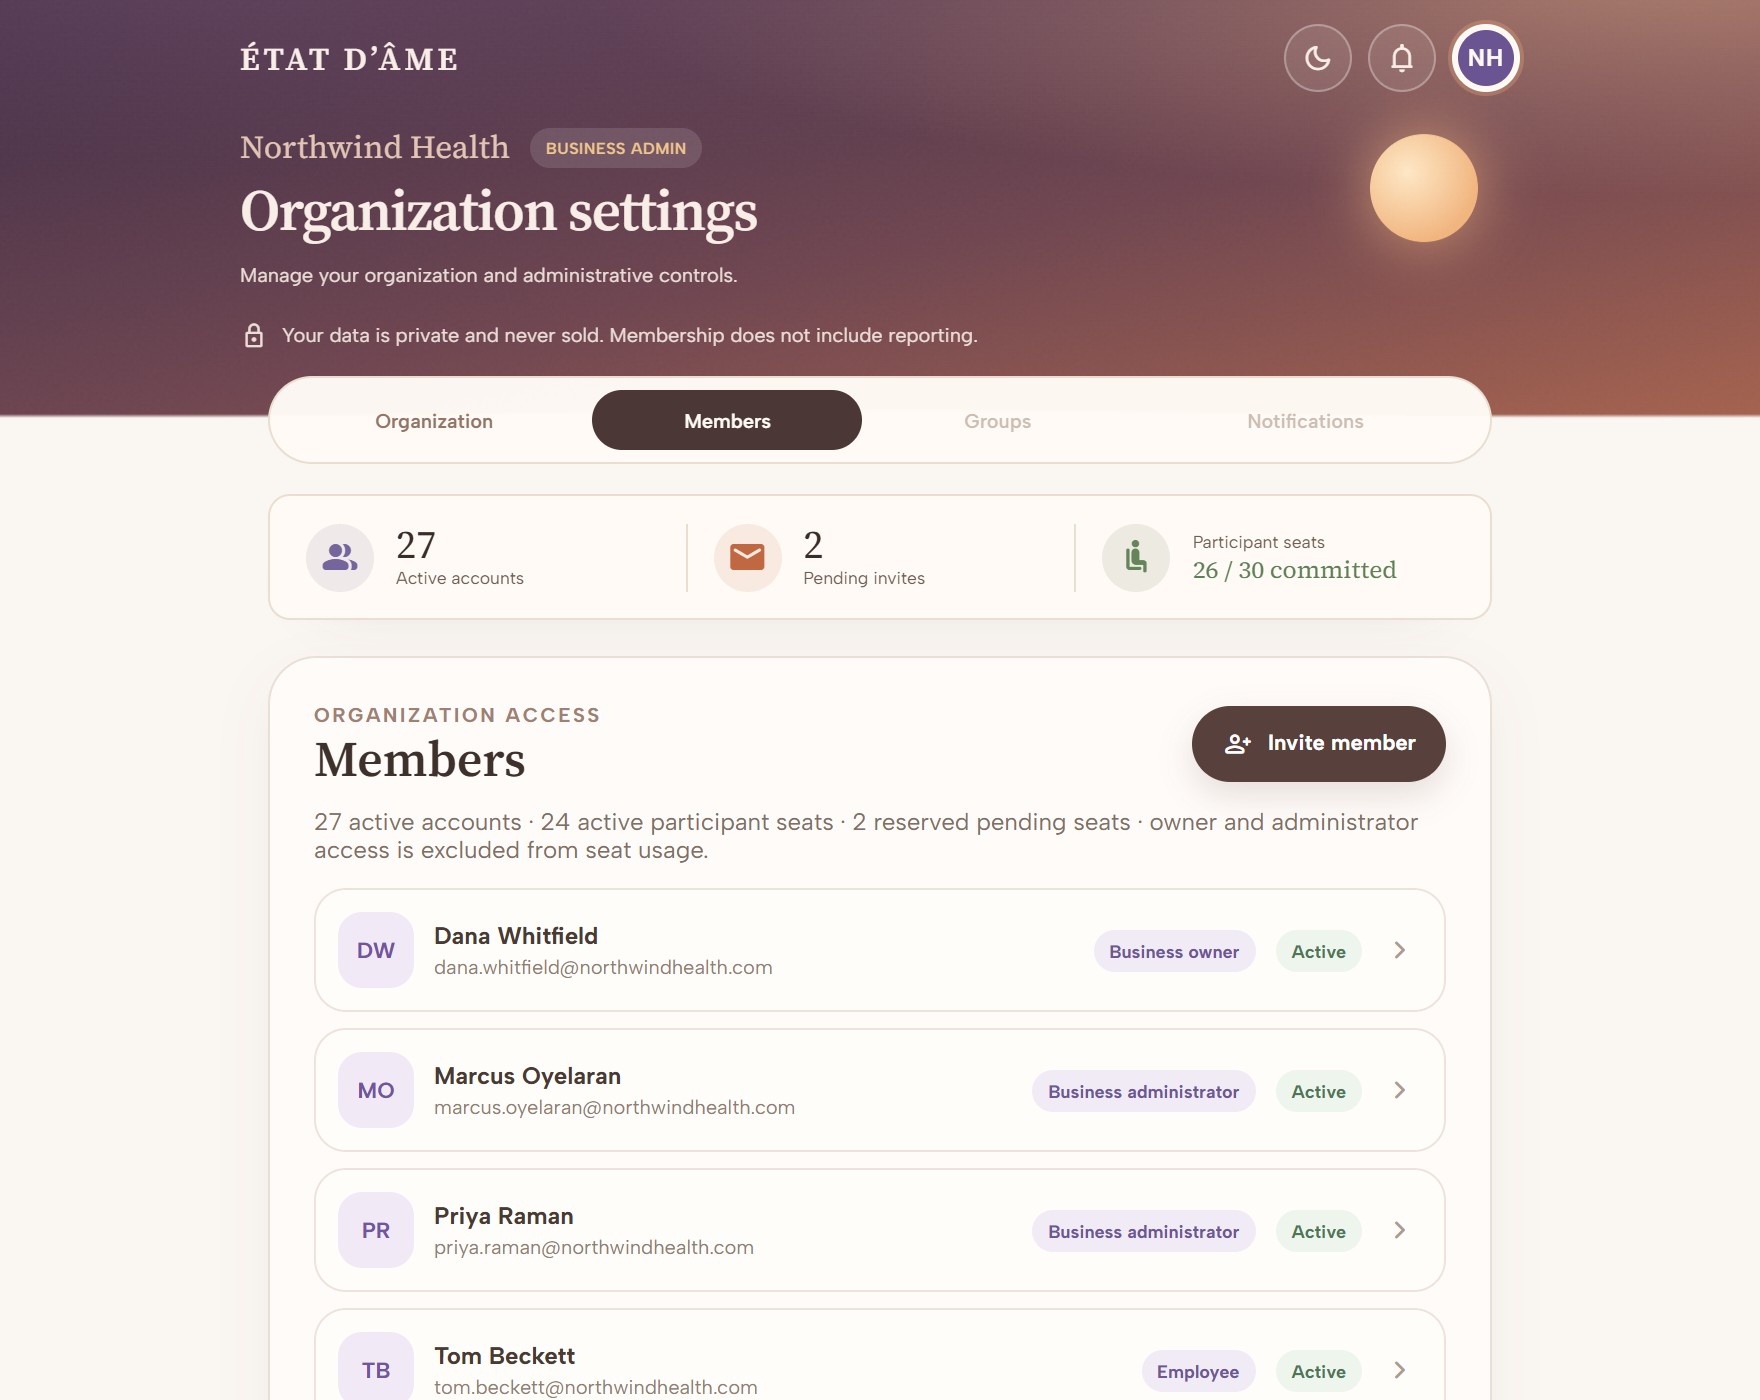
  • Members and rolesEvery account in the organization with its role and join date. Change a role, or remove access, from one place, in single sends or CSV batches.
  • Groups and approved domainsThe teams reporting is grouped by, and the email domains people are allowed to join from.
  • Organization profileContact, website and branding, plus the notification and delivery preferences that govern what the account sends.

“Administrative access only. Membership, invitation, and account metadata are shown here. Individual assessment results, activity history, and reporting permission remain separate.”

Shown at the foot of the administrative home screen
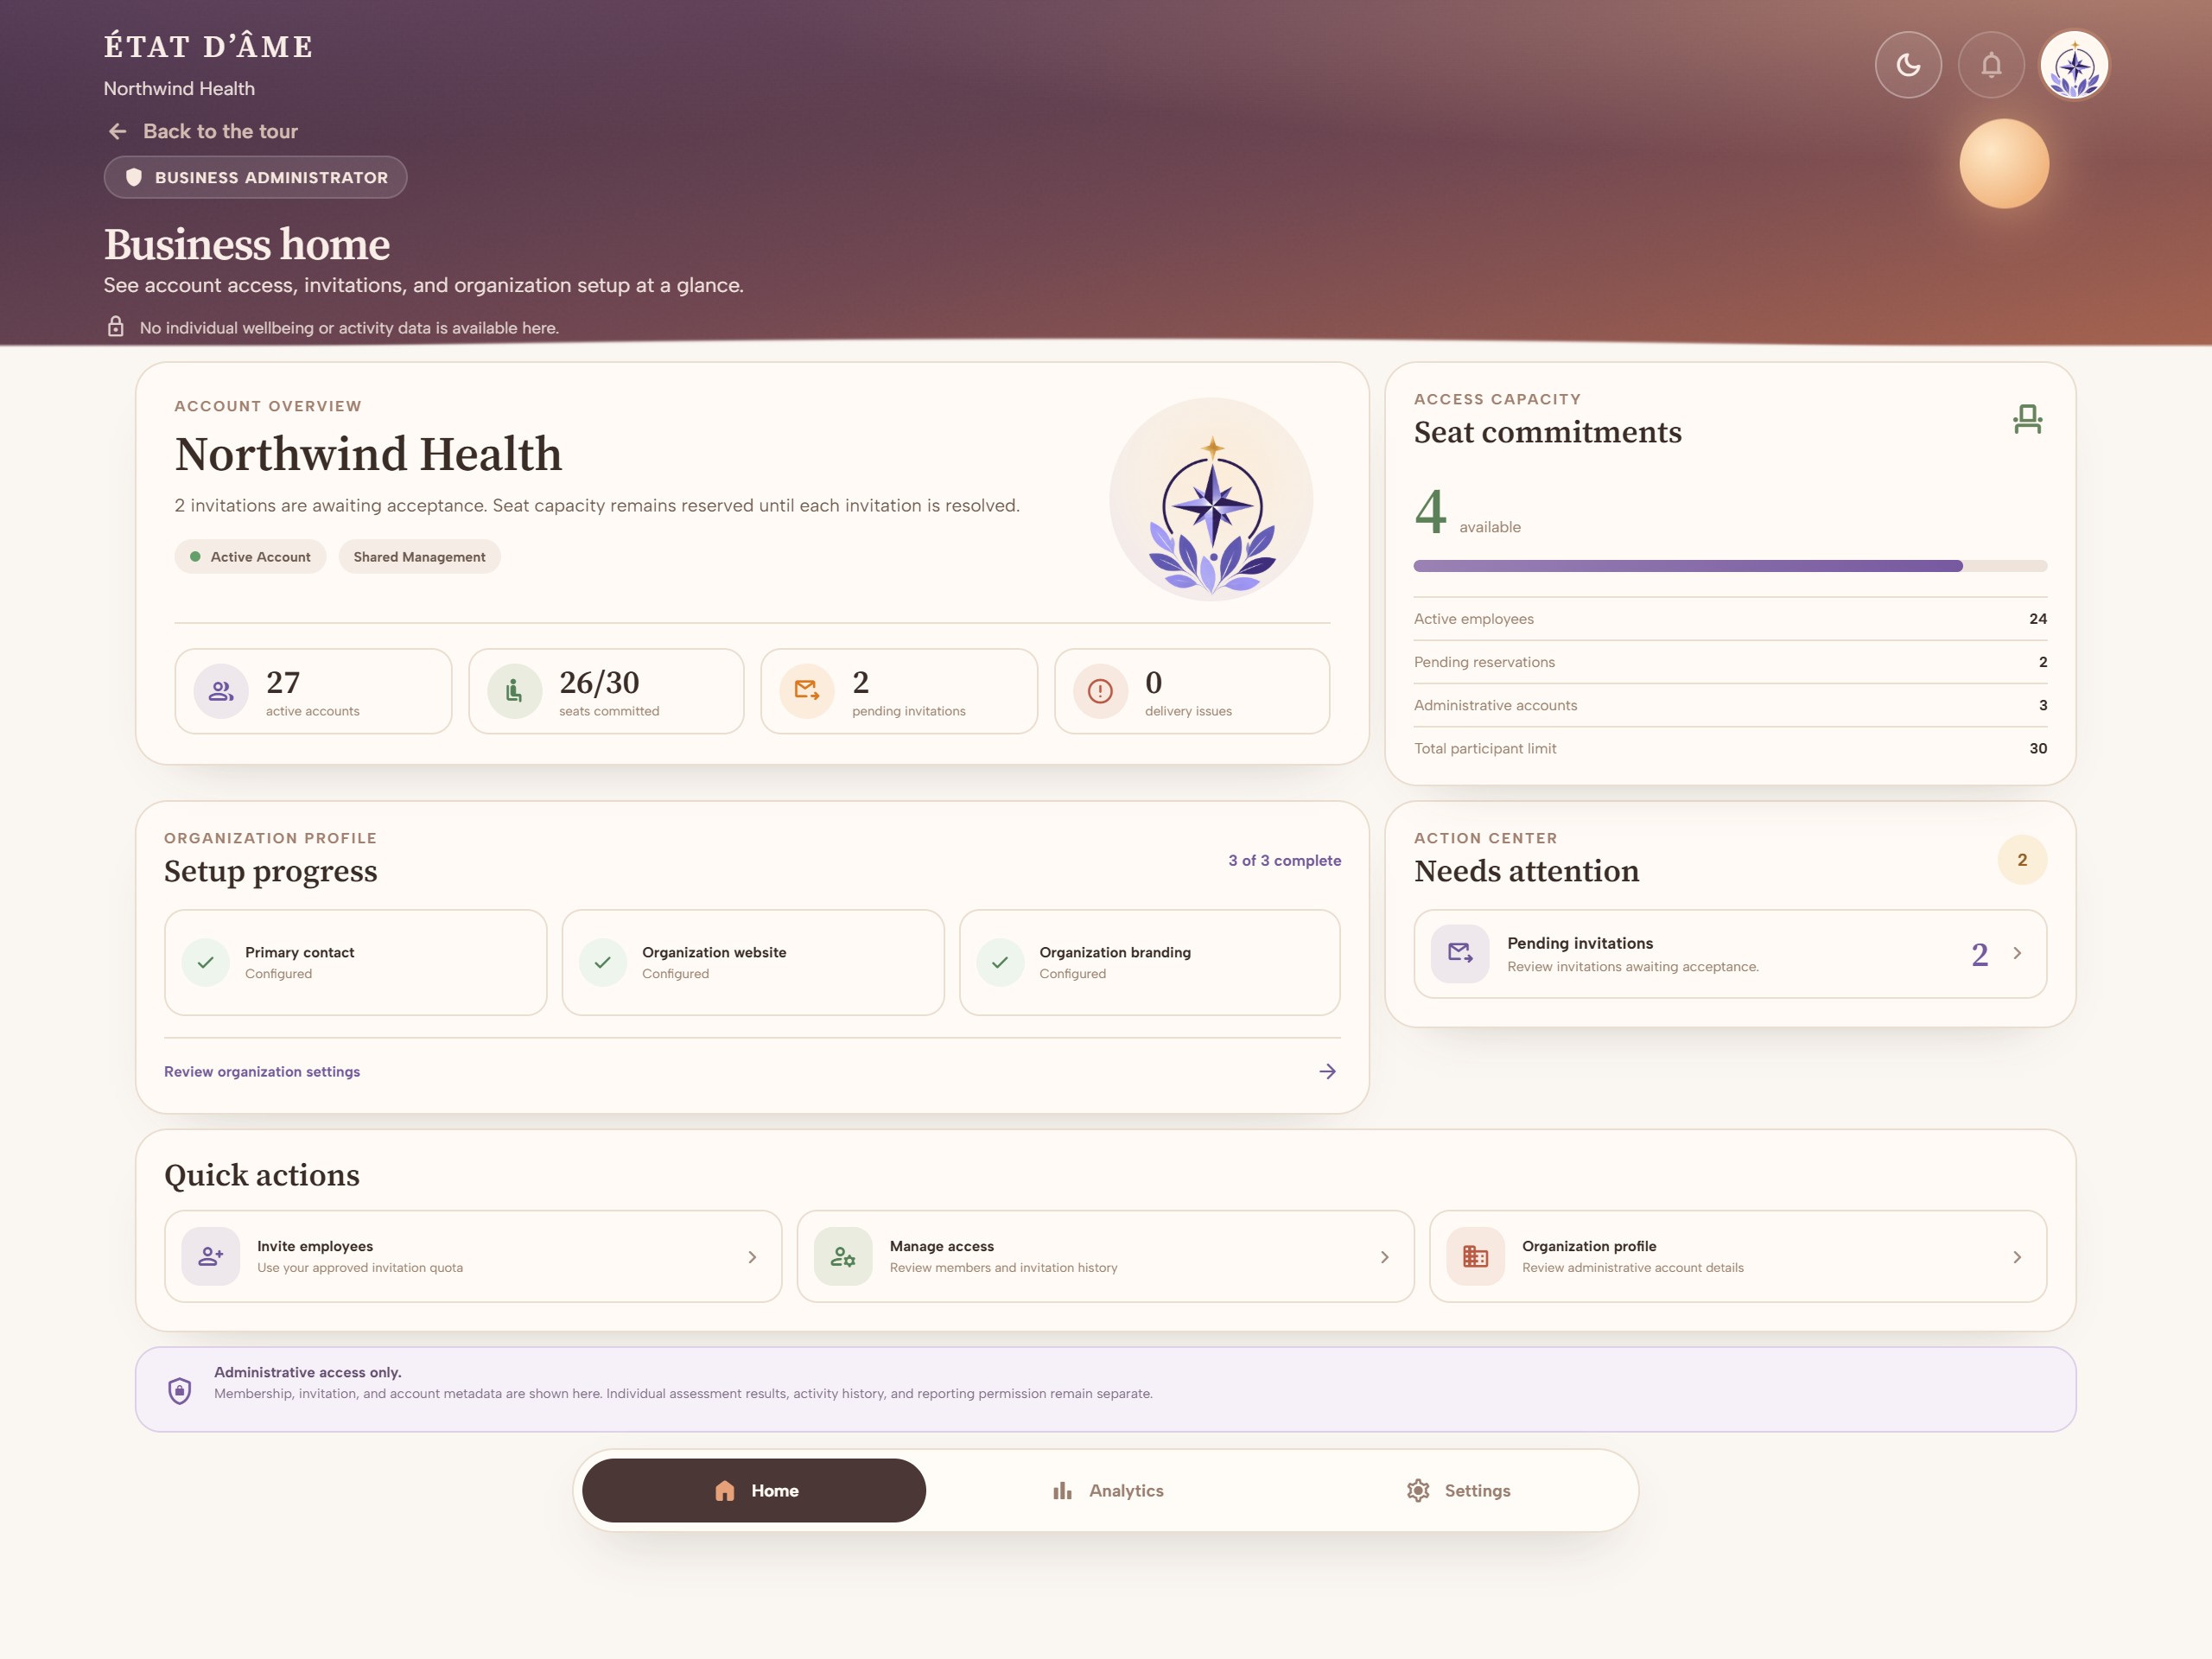
The administrative home screen: 27 active accounts, 26 of 30 seats committed, 2 pending invitations, no delivery issues, seat commitments broken down by employees, reservations and admin accounts, a complete organization profile, and quick actions to invite employees and manage access.
The members tab of organization settings: 27 active accounts, 2 pending invites, 26 of 30 participant seats committed, and the member directory showing the business owner, two business administrators and the employee accounts beneath them.

The administrative surfaces: account overview, and member and invitation management.

See it for yourself

Open the workspace, right now.

Reporting and administration are two parts of one account, and the preview is the whole thing. It is the real interface running on sample data. No account, no sign-in, and nothing you click is saved.

Open this on a laptop. The organization workspace is built for a desktop screen. Group comparison, member tables and seat management all need the room. The personal app your employees use is built for both phone and desktop.

The organization workspace

A sample account for a company of 27, with 26 of 30 seats committed, two invitations awaiting acceptance, and 128 reporting members across six teams behind eight weeks of trend data. The bar at the bottom of the screen moves between all three views.

  • HomeSeats, invitations and account setup
  • AnalyticsOrganization Overview, groups and policies
  • SettingsMembers, groups and notifications
Open the workspace preview

Every name, email address, score and date in this preview is invented. It reads from a fixed sample built into the page rather than from any account, and every action that would normally write something stops and tells you it did not.

Bring your organization onto État d'Âme.

Tell us about your organization and we will be in touch to set it up.